Monitoring Jenkins Job With Prometheus and Grafana

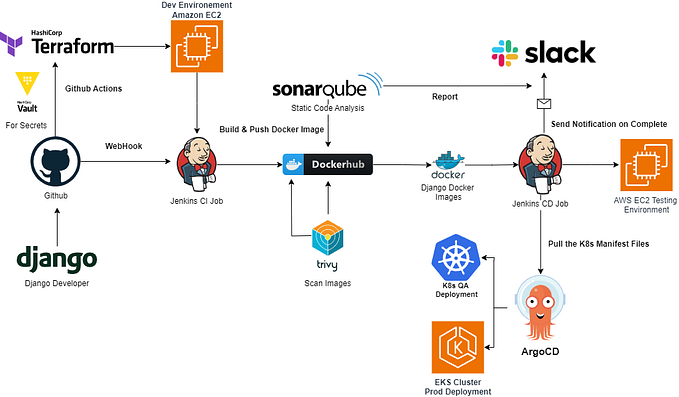
In this tutorial, I will guide you on how to set up Prometheus to monitor Jenkins and use Grafana to create a dashboard containing information from Jenkins. This article is continous stop from previous article in here
Monitoring is the process of continuously collecting data on the health, performance, and availability of systems, software applications, and network infrastructure. This activity is a crucial component of DevOps practices.
Prometheus is an open-source monitoring and alerting system that is specifically designed for modern software environments. On the other hand, Grafana is an open-source visualization and analytics platform. By integrating these two tools with Jenkins, we can create a monitoring system.
In this article, I will run Jenkins, Promotheus and Grana using Docker
Overall, this is the step we gonna do
- Instal and configure Prometheus plugin in Jenkins
- Run Docker container for Prometheus and Grafana
- Configuring Prometheus to be able take metrics from Jenkins
- Use Grafana to visualize metrics from Prometheus
Install Prometheus Plugin
- Access jenkins you had created in browser

2. At dashboard page, Open menu Manage Jenkins then click on Manage Plugins
3. In plugin manager, click on tab Available and search Prometheus metrics in search box

4. Check Prometheus metrics and click download button Download now and Install after restart
5. After “Downloaded successfully” shown, Checkbox Restart Jenkins when installation is complete and no jobs are running. Jenkins will restart after that
6. Login into Jenkins then go to the Manage Jenkins -> Configure System page.
7. Scroll down to the Prometheus section. Prometheus works by retrieving data from the endpoint that we specify. In this case, by default Prometheus will retrieve Jenkins metrics from the /prometheus endpoint. We can replace it by changing the Path section.

8. Pay attention to the Collecting metrics period in seconds section. This config sets how often metrics will be exposed in seconds. The default is 120 seconds, but let’s try changing it to 5 seconds so that metrics collection is faster. Change the value to 5.
9. Pay attention to several checkboxes below such as Count duration of successful builds, Count duration of unstable builds, and others. They are some metrics that will also be exposed by the Jenkins server.
10. After that, save by clicking the Save button. In order for the changes just made to be implemented effectively, we need to restart Jenkins. Add the /restart suffix to the Jenkins URL (for example, http://localhost:49000/restart) and press Enter. Then, click Yes.
11. Jenkins will restart automatically. Log in again until shown the Jenkins dashboard.
12. Now, try adding the /prometheus suffix to the Jenkins URL, for example http://localhost:49000/prometheus. Here we will see a large number of metrics. Note, when we open /prometheus, it will redirect us to /prometheus/. This is important because we configure Prometheus later

13. Prometheus will retrieve Jenkins metrics data from this endpoint. Because we have changed the metrics collection period to 5 seconds, the Jenkins server will expose metrics to this endpoint every 5 seconds. If refreshed periodically, we will see that some data will change.
By this we have install prometheus plugin in Jenkins. Let’s go to the next step
Run Prometheus and Garafana
In this stage we will run Prometheus and Grafana with Docker
- Open terminal
2. Type the following command. This command will run a Docker container named prometheus in the background on port 9090 taken from the prom/prometheus image in Docker Hub
docker run -d --name prometheus -p 9090:9090 prom/prometheus3. Next, type the following command to run the Docker container named grafana detachably on port 3030 taken from the grafana/grafana image in Docker Hub.
docker run -d --name grafana -p 3030:3030 -e "GF_SERVER_HTTP_PORT=3030" grafana/grafana*Note: by default grana is running on port 3000. We set the port to 3030 because port 3000 is already use by my project before
4. Now, Prometheus and Grafana containers are running. Try to prove it by accessing the URLs http://localhost:9090/ (Prometheus) and http://localhost:3030/ (Grafana) in your browser to make sure both are accessible.


Configure Prometheus
We have successfully installed the Prometheus plugin and created endpoint metrics, but Prometheus cannot be used directly to monitor Jenkins.
By default Prometheus only exports its own metrics. In order to monitor the system outside Prometheus, we must use the Prometheus exporter. Prometheus metrics plugin in Jenkins works by exposing metrics to an endpoint (namely /prometheus by default) when the Prometheus server can later retrieve data from that endpoint.
So, what we need to do is configure the Prometheus server so that it can recognize these endpoints.
- Let’s first check the metrics on Prometheus. Open http://localhost:9090/ in browser
- Then click the Open metric explorer icon next to the Execute button

3. Later the Metrics Explorer will appear which contains various metrics that we can see

4. From the list of metrics, we don’t have Jenkins metrics yet. For that we need to configure it by entering the Prometheus container. run the following command
docker exec -it prometheus sh
5. After we enter the container, open the prometheus.yml file with the following vi editor command
vi /etc/prometheus/prometheus.yml6. To be able to edit, press insert on the keyboard then on the last line, add the following code to define the job name (task name), metrics path (Jenkins metrics location endpoint), and targets (Jenkins URL)
  - job_name: "jenkins"
    metrics_path: /prometheus/
    static_configs:
      - targets: ["<localhost/IP_ADRESS>:8080"]
The file prometheus.yaml will look like this

7. To save, press Esc on the keyboard then type :wq then Enter. Type Exit to exit the container
8. After that, restart the Prometheus container to apply the new settings
docker container restart prometheus9. Access the Prometheus page again with the URL http://localhost:9090/. Open the menu Status -> Targets

Notice our Prometheus is successfully integrated with Jenkins!
10. Return to the main page by clicking the Prometheus logo in the top left corner. Once open, click the Open metrics explorer icon right next to the Execute button.

14. Later the Metrics Explorer will appear containing various metrics. Pay attention, now our Prometheus also contains various metrics from Jenkins, such as default_jenkins_builds_health_score, default_jenkins_builds_last_build_duration_milliseconds, default_jenkins_builds_last_build_result, and various others.
Here we can check various metrics via Prometheus
15. Next, let’s try for example. Run again Jenkins pipeline. Go to Jenkins dashboard, click Open Blue Ocean choose react-app and click Run
16. Wait until pipeline complete. See how long Jenkins execute the pipeline

The pipeline is executed 4m 15s
17. Back to tab Prometheus, Click on Open metrics explorer then choose metrics default_jenkins_builds_last_build_duration_milliseconds to see how long last build duration in miliseconds. Click Execute

last build duration is 254.667 miliseconds = 254.6 seconds = 4.24 minutes. It’s same with the result from Jenkins because prometheus take metrics from Kenkins
Create Dashboard in Grafana
Next we will visualize the metrics in Grafana
- Go to page Grafana in <localhost>:3030. In login page, fill username and password admin
- You will be asked to create new password. Fill new password or skip. After that the grafana dashboard will appear

3. Next step is create a Data Sources. From Home page, click add your first data source
4. Choose option Prometheus and fill :
- Name: Jenkins-Prometheus
- URL : <IP_Adress>:9090

5. Click Save & test. If success there will be pop up message

6. Next we will create Grafana dashboard. Scroll up and click build a dashboard -> Create your first dashboard -> Add visualization

7. Fill this config
- Title: Last build duration
- Description: Last build duration
- Transparent background: Active
- Graph mode: None
- Metric:default_jenkins_builds_last_build_duration_milliseconds
8. Click button Run queries. Save the panel by click Save

9. We can get dashboard too from a template. Search on google Grafana Dashboard then find Jenkins and filte by Prometheus in Data Source

10. Back to dashboard we created before. In the right menu click New -> Import
11. Paste ID from Grafana Dashboard the click Load

12. In the next page, in data source, choose Prometheus — Jenkins. Click Import

13. Now we will see various metrics in Grafana

That’s it. Now we success to monitoring Jenkins with Prometheus and Grafana!
Sincerely
References


